
Compass is Clover Group's carbon reporting platform. It produces a CO₂ emissions figure for every shipment we handle - calculated from the actual route, mode, weight, and distance, not from an industry average.
CARBON COMPASS
KNOW YOUR CO2 FOOTPRINT

Clover’s Compass Carbon Reporting platform enables each shipment to include a CO2 emissions calculation, giving users transparency over their environmental impact.
COMPLIANCE

◦ EU CBAM Legislation – Ensuring compliance with upcoming sustainability regulations.
◦ ESG Values – Supporting corporate responsibility initiatives.
COMMITMENT TO SUSTAINABILITY

◦ Helps businesses track & reduce their carbon footprint.
◦ Drives decision-making towards greener logistics options.
HOW IT WORKS
Shipment-level CO₂ calculation - Every movement gets its own emissions figure, built from actual route and mode data using our in-house API metrics.
Average Comparator - Each shipment is benchmarked against your company's rolling average across three dimensions - carbon, cost, and delivery timeframe - expressed as a percentage variance. You can see immediately where each shipment sits relative to your own baseline.
Priority optimisation - Set your priority - cost, speed, or carbon - and we plan the route accordingly. The trade-off between these three factors is shown before the shipment moves.
Report output - PDF and CSV. Compatible with major ESG reporting frameworks.
EU CBAM alignment - Compass data supports Carbon Border Adjustment Mechanism compliance for carbon-intensive imports - steel, aluminium, cement, fertiliser, electricity, and hydrogen.
CSRD-ready data - Supports Scope 3 emissions disclosure for clients preparing reports under the EU Corporate Sustainability Reporting Directive.
System integration - API-compatible with existing logistics management and ERP systems.
Carbon calculation methodology - Download the Compass carbon methodology here.
THE AVERAGE COMPARATOR
The Average Comparator benchmarks each shipment against your own historical data, not an external standard. Over time, procurement and ESG teams can track where the supply chain is improving and where it isn't - and use that data to make more deliberate routing decisions. The figures above are from an example report; your own data will reflect your specific routes, modes, and volumes.
EXAMPLE
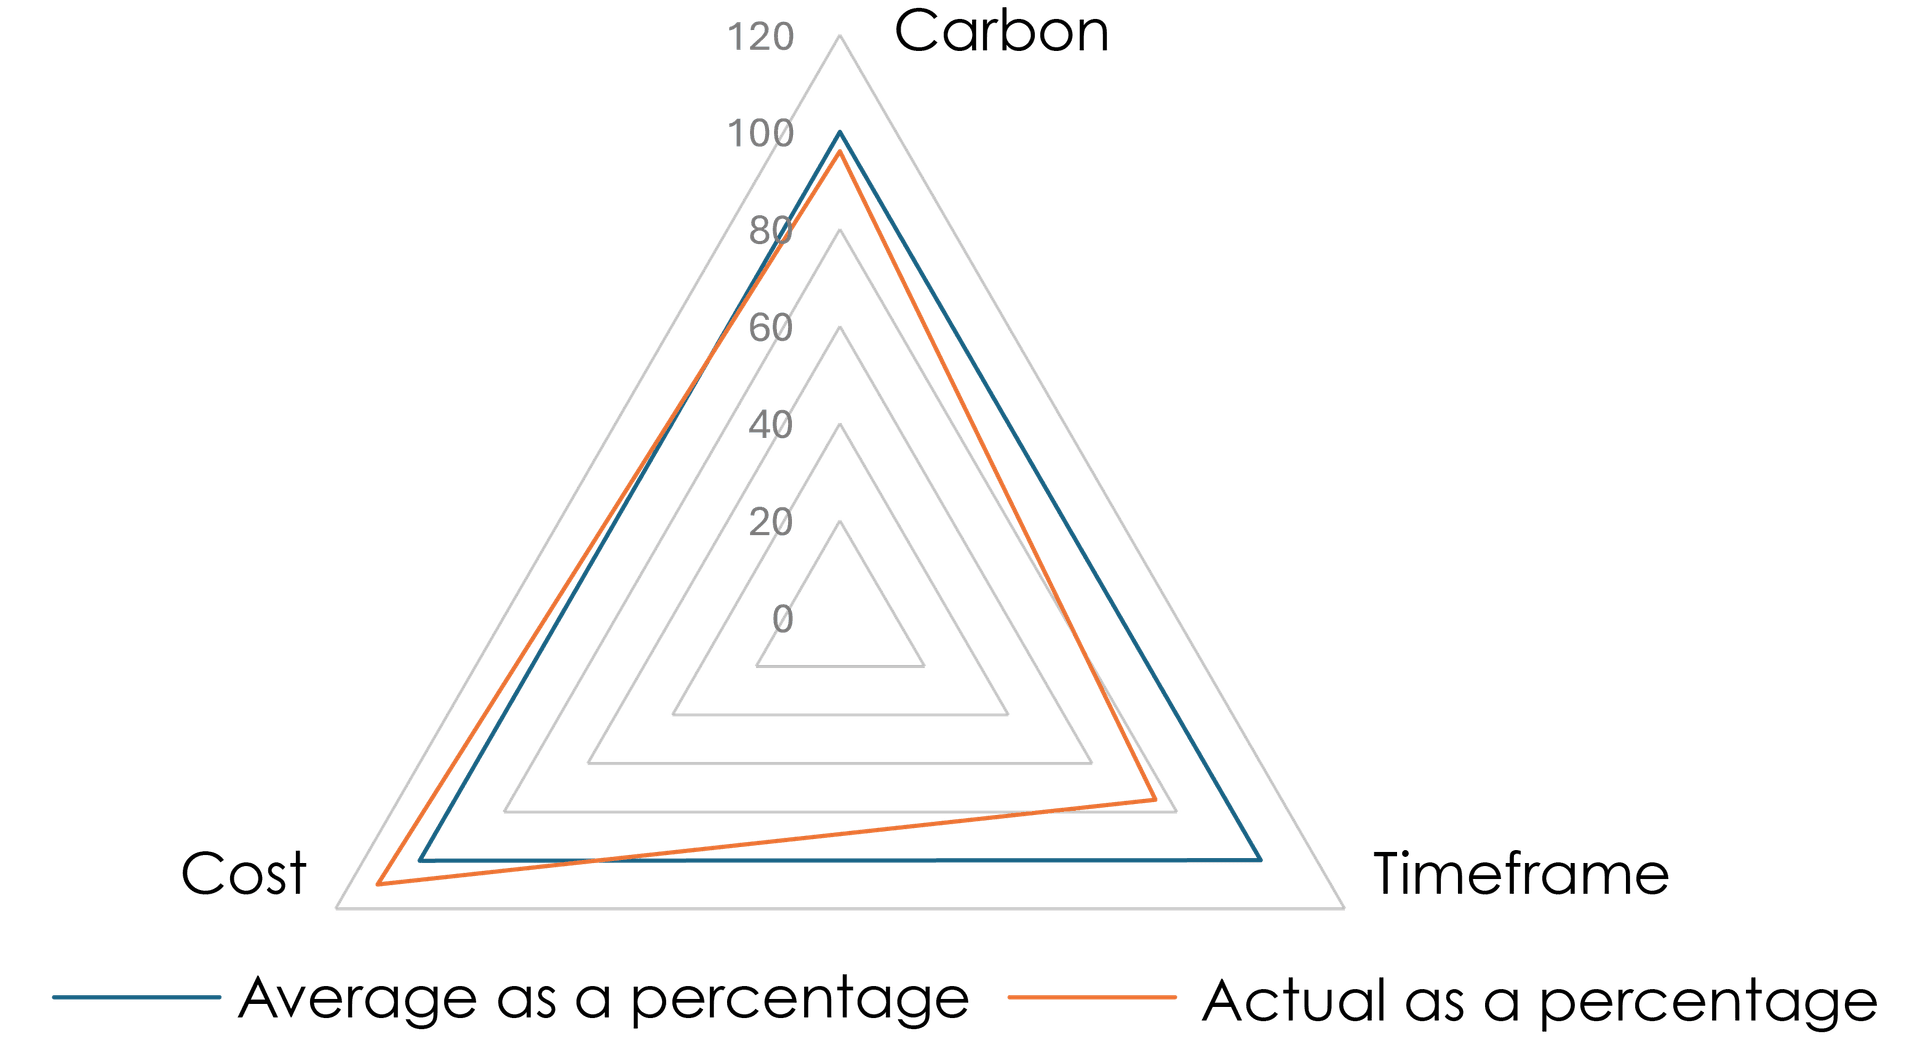
The Average Comparator assesses the shipment’s cost, timeframe and carbon emissions against the company’s average, expressed as a percentage.
The comparisons for this shipment against the company’s average are as follows:
• Carbon Emissions were 4% less than average
• Costs were 10% higher than average
• Delivery Timeframe was 25% quicker than average
REQUEST A COMPASS DEMONSTRATION
Request a demonstration and we'll walk you through a report - showing how Compass calculates emissions by route and mode, how the Average Comparator benchmarks each shipment against your own historical data, and how the output maps to your ESG reporting requirements.